High Speed Scanning AFM
Nano Life Science Institute (WPI-NanoLSI), Kanazawa University
website:http://biophys.w3.kanazawa-u.ac.jp/index.htm
more information about Prof. Toshio Ando
High-speed AFM (HS-AFM) has made it possible to directly visualize dynamic phenomena occurring in nano-spaces in liquid environments. In the biological field, this microscopy is widely used to observe dynamic processes of biological molecules (proteins, DNA, and others) during their functional activity. It is also used to observe morphological changes of live cells and dynamic processes occurring on their surfaces, although this type of applications are so far not many. In material sciences, HS-AFM is used to observe dynamic processes occurring in synthetic polymer chains [1], detergents [2], and nano-bubbles [3], and corrosion reactions at solid-liquid interfaces [4], resolution of photoresists [5], crystallization of inorganic and organic materials [6], electrochemical reactions [7], and others. The visualized dynamic phenomena are straightforward, easy to understand, and convincing. Not only known facts but also novel facts appear in filmed images, accelerating the progress of science. This short article outlines some of techniques underlying HS-AFM and showcases two representative studies on proteins. For more details of techniques and fundamentals, see Reviews [8−10]. For details of biological application studies, see Reviews [11−13].
During raster scanning of the sample stage, it is also scanned in the Z-direction via feedback control to maintain the tip-sample contact strength constant. Although there is also a tip scanning type of AFM, it is not considered here. The sample height under the tip changes by the raster scanning. The cantilever senses this height change. Through signal input/output devices, the sample stage is finally Z-scanned. Fig. 1 shows the feedback loop employed in the amplitude modulation mode, where the cantilever is excited to oscillate at its first resonant frequency and its amplitude signal is used to control the sample stage Z-position. Each device has a time delay in its response. Therefore, it takes time until the completion of the feedback Z-scanning at each height change event. In HS-AFM, all devices are optimized for their fast response. Moreover, vibrations, which are apt to be generated by fast scanning of the sample stage, are well suppressed by several methods.
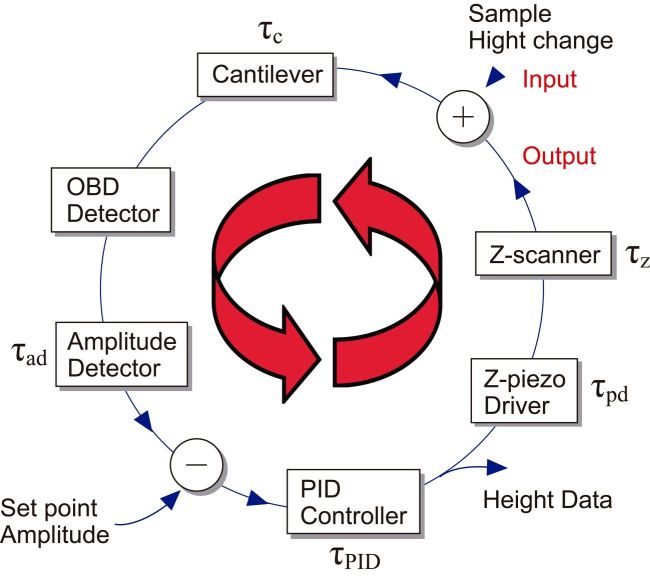
Among these devices, the Z-scanner and the cantilever are mechanical devices, and therefore, their response is slow, compared to the electronics devices. The cantilever response time τc is given by τc = Qc/(πfc), where Qc is the quality factor in liquid quantifying the resonance sharpness, and fc is the first resonant frequency in liquid. To shorten τc, fc should be increased (Qc can be small in liquid), while the spring constant has to be maintained at a small value (~0.1 N/m for biological samples). This requirement is fulfilled only by the miniaturization of the cantilever. Small cantilevers (10 μm long,2 μm wide and ~100 nm thick) are commercially available. They have kc = 0.1–0.2 N/m, fc = 400–800 kHz and Qc = 1–2 in water. We have been also using custom-made small cantilevers with fc = 1.2 MHz. The response time of the Z-scanner τz is approximately determined by the piezo actuator used there, and expressed as τz =Qz/(πfp) or τz = θp/(2πf), where θp is a phase delay at the driving frequency f. For a travel range of 0.5–1 μm, usually we can achieve fp ≈ 200 kHz when one end of the piezo actuator is held. The quality factor of piezo actuators is large, and therefore, Qz is reduced to ~1 by a Q-control method [14]. Techniques for fast deflection-to-amplitude conversion for the oscillating cantilever are also developed. We can measure the amplitude at every 1/4 cycle [15], 1/2 cycle [16], or one cycle of cantilever oscillation [8].
The black line in Fig. 2 shows temporal changes of the sample height under the tip caused by X-scanning of the sample stage at velocity Vx under no feedback control, where the sample is assumed to have a sinusoidal shape with periodicity λ and height h0 in the XZ plane. When the feedback controller is switched on, the Z-scanner moves in the direction opposite to the sample height. However, due to the timed delay (τ0) of feedback control its temporal trajectory (red line in Fig. 2) shifts to the right, compared to the black line. The sum of the black line and the red line represents feedback error (blue line in Fig. 2). This error becomes plus at the uphill region of the sample, whereas it becomes negative in the downhill. That is, at the uphill region the tip pushes the sample more strongly than the target strength, resulting in the cantilever amplitude being smaller than its set point. At the downhill region, the sample is less pushed resulting in the amplitude being larger than the set point. When Vx is increased further and hence the error becomes larger, the tip would lose contact with the sample. Once lost, it takes time for the tip to re-land on the sample surface, like “parachuting”. During parachuting, imaging becomes infeasible. Of course, we can avoid parachuting by using a smaller set point amplitude but the resulting larger pushing force would damage fragile samples. This parachuting problem significantly limits Vx and hence the imaging rate, in particular for fragile samples. This difficult problem was solved by the development of a feedback controller capable of automatic gain tuning during imaging [17].
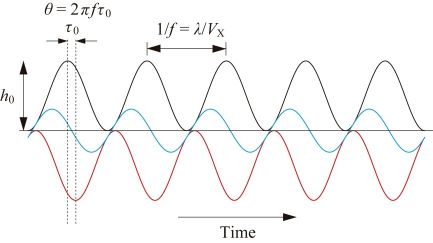
How large error would be acceptable? Although it depends on the sample fragility, the phase delay θ (see Fig. 2) is generally allowed to occur up to π/4. When the Z-scan frequency resulting in θ = π/4 is denoted with fB, we obtain fB =1/(8τ0) from the relationship 2πfBτ0 = π/4. This fB is called the feedback bandwidth. The feedback bandwidth is the best parameter representing the speed performance of the HS-AFM system including the cantilever. fB = 30–40 kHz for fc ≈ 500 kHz, and fB = 70–100 kHz for fc ≈ 1.2 MHz are already achieved. Under the conditions of the X-scan range ~200 nm and the number of scan lines 100, robust molecules with low height, such as DNA, can be imaged at 30–50 frames per sec (fps), and fragile protein molecules can be imaged around 10 fps. Technical developments towards further enhancement of fB are still in progress. We expect that even fragile protein molecules will be able to be imaged at 30–50 fps (hopefully at 100 fps) in the near future.
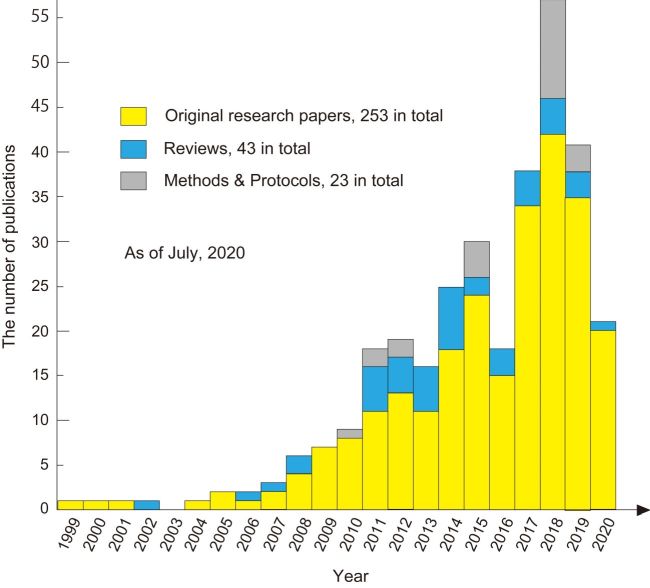
The number of publications of biological studies with HS-AFM is rapidly increasing in recent years (Fig. 3). More than 250 original papers have been published in total. Even prior to 2008 when the HS-AFM technology was established, imaging studies with HS-AFM were published. These studies were mainly performed to explore the potential of or test the performance of developed HS-AFM systems. A variety of biological samples and dynamic processes have been studied with HS-AFM. They can be largely categorized as (i) conformational changes of proteins during their functional activity, (ii) processes of self-assembly, disassembly and aggregation, (iii) structural fluctuations and transitions, (iv) dynamic interactions (association and dissociation), (v) enzymatic reactions (synthesis, degradation, and transformation), (vi) diffusion, (vii) cellular morphological changes and dynamics of proteins on cell surfaces, and (viii) dynamics in artificial systems made of biological materials. In addition to these imaging studies, (ix) force spectroscopy measurements with high loading rates have been performed with HS-AFM. Among these categories, dynamic processes of self-assembly, disassembly and aggregation are most studied by preference. The next category of preference is conformational changes of proteins during their functional activity. Two representative studies on proteins are outlined below.
Myosin V (M5): M5 is one of motor proteins that function as cargo transporters in the cell. Single molecules of M5 move along actin filaments over a long distance. This property (i.e., processivity) promoted the study of myosin motility because it enabled continuous measurements of the motor action of individual molecules by means of single-molecule fluorescence microscopy and optical trap nanometry. In fact, for a decade since 1999 many single-molecule biophysical studies were extensively performed for M5. Through these studies, it was revealed that in every ATP hydrolysis cycle, M5 steps forward by ~36 nm in a hand-over-hand manner, and that this style of movement is made possible by the intramolecular strain-mediated retardation of ADP release from the leading head. Despite these fundamental discoveries, the single-molecule studies could not resolve the crux of the motor mechanism; that is, how the tension for the forward step is generated in the molecule and how the energy liberated by ATP hydrolysis is used for mechanical work? Therefore, M5 was the best target of HS-AFM to show how clearly and profoundly HS-AFM imaging of dynamic molecular processes can solve important questions. As described below, the HS-AFM study on M5 led to unexpected discoveries [18].
The C-terminal part of the log tail of M5 was truncated by proteolysis. Partially biotinylated actin filaments were attached to the surface of mica-supported lipid bilayer containing electrically neutral phospholipid and biotin-lipid, through surface-attached streptavidin at a low density. This surface is resistant to non-specific protein binding. In fact, only M5 bound to and moving unidirectionally on actin filaments appeared in the images. The moving velocity was identical to that observed with fluorescence microscopy, indicating no effects of the tip−sample and surface−sample interactions on the motor activity. However, most of the M5 molecules stood on actin filaments, and therefore, their characteristic bi-pedal structure was not well resolved. To facilitate weak sideways attraction of M5 onto the lipid bilayer surface, a positively charged lipid was added to the lipid bilayer at a low density. As shown in Fig. 4B, moving M5 molecules were clearly imaged. However, to resolve the stepping process, its motion was needed to be moderately prohibited by the addition of more streptavidin molecules to the surface. As shown in Fig. 4C, upon detachment of the trailing head from actin, the nearly straight leading head spontaneously rotated from the backward leaning orientation to the forward leaning orientation. This rotation is the lever-arm swing itself proposed by Hugh Huxley for muscle myosin. Even in the absence of nucleotide, the two heads of M5 were bound to the same actin filament. The two-headed bound molecules showed a sharply bent leading head, in contrast to the straight leading head (slightly curved outwardly) in the presence of 1-2 μM ATP or 1 mM ADP. This means that we can judge whether or not the leading head contains nucleotide just by looking at the shape of the leading head. We measured the lifetime of the straight leading head as a function of ADP concentration, from which the rate of ADP dissociation at the leading head was estimated to be 0.1/s. However, M5 steps many times during 10 s. Thus, it was concluded that in walking M5 the sequential events of ADP release, subsequent ATP binding, and resulting head dissociation take place solely at the trailing head, which is the basis underlying the processive hand-over-hand stroke generation.
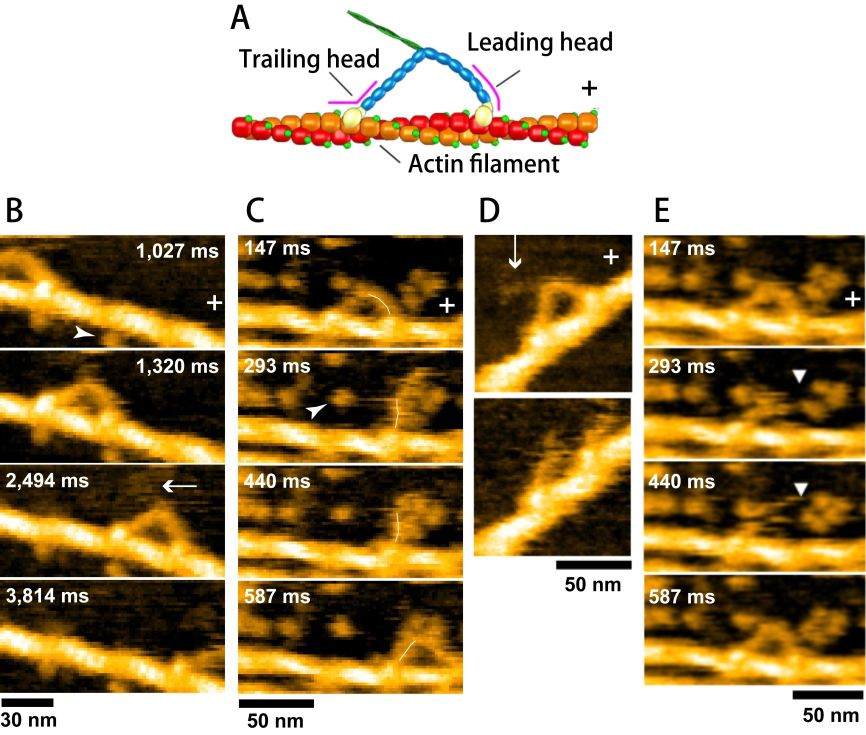
The HS-AFM observations described above provided corroborative “visual evidence” for the swinging lever-arm hypothesis and the previously proposed kinetic mechanism underlying the hand-over-hand movement. However, unexpected phenomena also appeared in the filmed images. Two-headed bound M5-HMM in the presence of 1 mM ADP occasionally underwent unwinding of its coiled-coil tail, immediately after which the monomerized leading head rotated spontaneously from the backward leaning orientation to the forward leaning orientation (Fig. 4D), very similar to the swinging lever-arm motion. These behaviors suggest that without ATP energy an intramolecular tension is generated in the two-headed bound molecule and this tension is used for the lever-arm swing in the leading head. Moreover, we found a behavior that we called “foot stomp”. That is, in the presence of ATP, the leading head briefly dissociated from actin and re-associated with the same actin filament, after which the molecule stepped forwards by spontaneous swinging of the leading head upon trailing head detachment from actin. These phenomena indicate that the chemical energy liberated from ATP hydrolysis is not used for the intramolecular tension generation and the lever-arm rotation. The ATP energy is mostly used as binding energy to detach the trailing head from actin, and therefore not converted to mechanical work performed by M5. The energy liberated by ATP hydrolysis is only used to increase the efficiency of one-directional mechanical process. These findings overturn the conventional concept of energy usage in myosin.
F1-ATPase: F1-ATPase is a half part of the ATP synthase. Its functional unit consists of an α3β3 ring and a γ subunit inserted to the central pore of the ring (Fig. 5A). The ATPase sites locate mainly in the β-subunits. Optics-based single-molecule measurements have established that F1-ATPase is a rotary motor. The α3β3 ring and the γ-subunit function as a stator and a rotor, respectively. When the γ-subunit is viewed from the top, it rotates counter-clockwise. From biochemical studies, the three β-subunits are known to be unable to take the same nucleotide sates simultaneously. That is, the three β-subunits take either the ATP-bound, ADP-bound, or empty states. When ATP is hydrolyzed into ADP in the ATP-bound β-subunit, the two other β-subunits transit to the ATP-bound state from the empty state, and to the empty state from the ADP-bound state. Thus, the γ-subunit is considered to rotate by the counter-clockwise propagation of the chemical transitions. However, it is difficult to understand how the three β-subunits communicate with each other to take the different nucleotide states because they do not make direct contact with each other. For this riddle, the “γ-dictator model” was proposed, in which the γ-subunit rules the nucleotide states taken by the three β-subunits [19]. This theory is convincing because the γ-subunit has no symmetric structure and hence the three β-γ interactions are always different. However, how can we prove this theory experimentally? Optics-based measurements cannot detect rotation or no-rotation without the γ-subunit. The HS-AFM observation of the α3β3 ring described below not only solved this paddle but also led to a surprising discovery [20].
An aminosilane-coated mica surface was treated with glutaraldehyde to make it amino-reactive. A Lys7 tag was introduced to the N-terminus of the β-subunit, and then the α3β3 ring was covalently immobilized on the amino-reactive surface. In this configuration, the C-terminal central pore of the ring faces the free solution space. From comparison between an AFM image of the ring in the absence of nucleotide and a pseud-AFM image simulated from the corresponding crystal structure, the three protuberances around the central pore protruding in the Z-direction were identified to belong to the three β-subunits (Fig. 5B). Next, an AFM image of the α3β3 ring taken in the presence of AMP-PNP showed only one protuberance. From its comparison with a pseud-AFM image simulated from the crystal structure containing nucleotides, this protuberance was identified to belong to the empty β-subunit (Fig. 5C). HS-AFM images taken in the presence of ATP showed a counter-clockwise rotary shift of a single protuberance over the three β-subunits (Fig. 5D). This clearly revealed that the empty state rotates counter-clockwise over the three β-subunits, and hence, the other two chemical states also propagate counter-clockwise. This state propagation is conducted only through an interplay between the three β-subunits, without the γ-subunit. Thus, it is concluded that the γ-subunit is passively subjected to the torque generated by the three β-subunits. This fact predicts that an object (not necessarily made of polypeptides) that can be inserted into the central pore of the α3β3 would be able to rotate driven by the rotational conformational changes of the β subunits. This prediction was verified later [21].

As space is limited, only the two studies are described here, but I believe that these two representative studies could demonstrate an innovative power of HS-AFM imaging. Many samples are still waiting for being imaged with HS-AFM. Actual imaging of new samples will surely lead to unexpected new findings. I hope, as a developer of HS-AFM, that many researchers and students will use HS-AFM and make exciting discoveries.
For a list of publications on biological studies with HS-AFM click here.